Duke Energy is one of the largest regional emitters of carbon, and it also has perhaps the most ambitious decarbonization goal in the Southeast. When Duke first announced a net-zero by 2050 target, SACE welcomed the news but added the important caveat that the devil is in the details. Duke recently filed its integrated resource plan (IRP), or long-term plan of where the utility will receive its power from which, to put it lightly, does contain many details.
Although bits and pieces of Duke’s decarbonization strategy have been revealed through a net-zero analysis in its climate report and (underwhelming) resource plans in Florida, the IRP filed in North Carolina last week marks one of the most substantial opportunities thus far to make good on its decarbonization goal. SACE and many other advocates are still digesting the contents of the filing and its many appendices, but in the meantime, we’ll share context from the latest iteration of our Tracking Decarbonization in the Southeast report.
[button color=”blue” url=”https://bit.ly/SEEmissionsReport2020″]Download the Report[/button]
[button color=”blue” url=”https://cleanenergy.org/?s=SEEmissionsReport2020″]Read the Report Series[/button]
[button color=”blue” url=”https://cleanenergy.org/news-and-resources/webinar-tracking-decarbonization-in-the-southeast-2020-report/”]Watch the Webinar[/button]
How much of difference can a state’s resource planning process really make?
Before getting into the news coming out of the Carolinas, let’s look at the broader context for Duke in the region. As is the case with other large utility systems, Duke is an overarching company that has multiple utilities across the region. In the Southeast, it has three operating companies: Duke Energy Progress, Duke Energy Carolinas, and Duke Energy Florida. The fact that these companies operate separately and in different states matters a lot when it comes to tracking progress towards decarbonization goals. The company must coordinate efforts in different states which have different rules about how resource planning is handled. As a result, the emissions intensity (measure of lbs of carbon dioxide per megawatt-hour) for different Duke utilities shows two extremes between Florida and the Carolinas, highlighted in blue below.
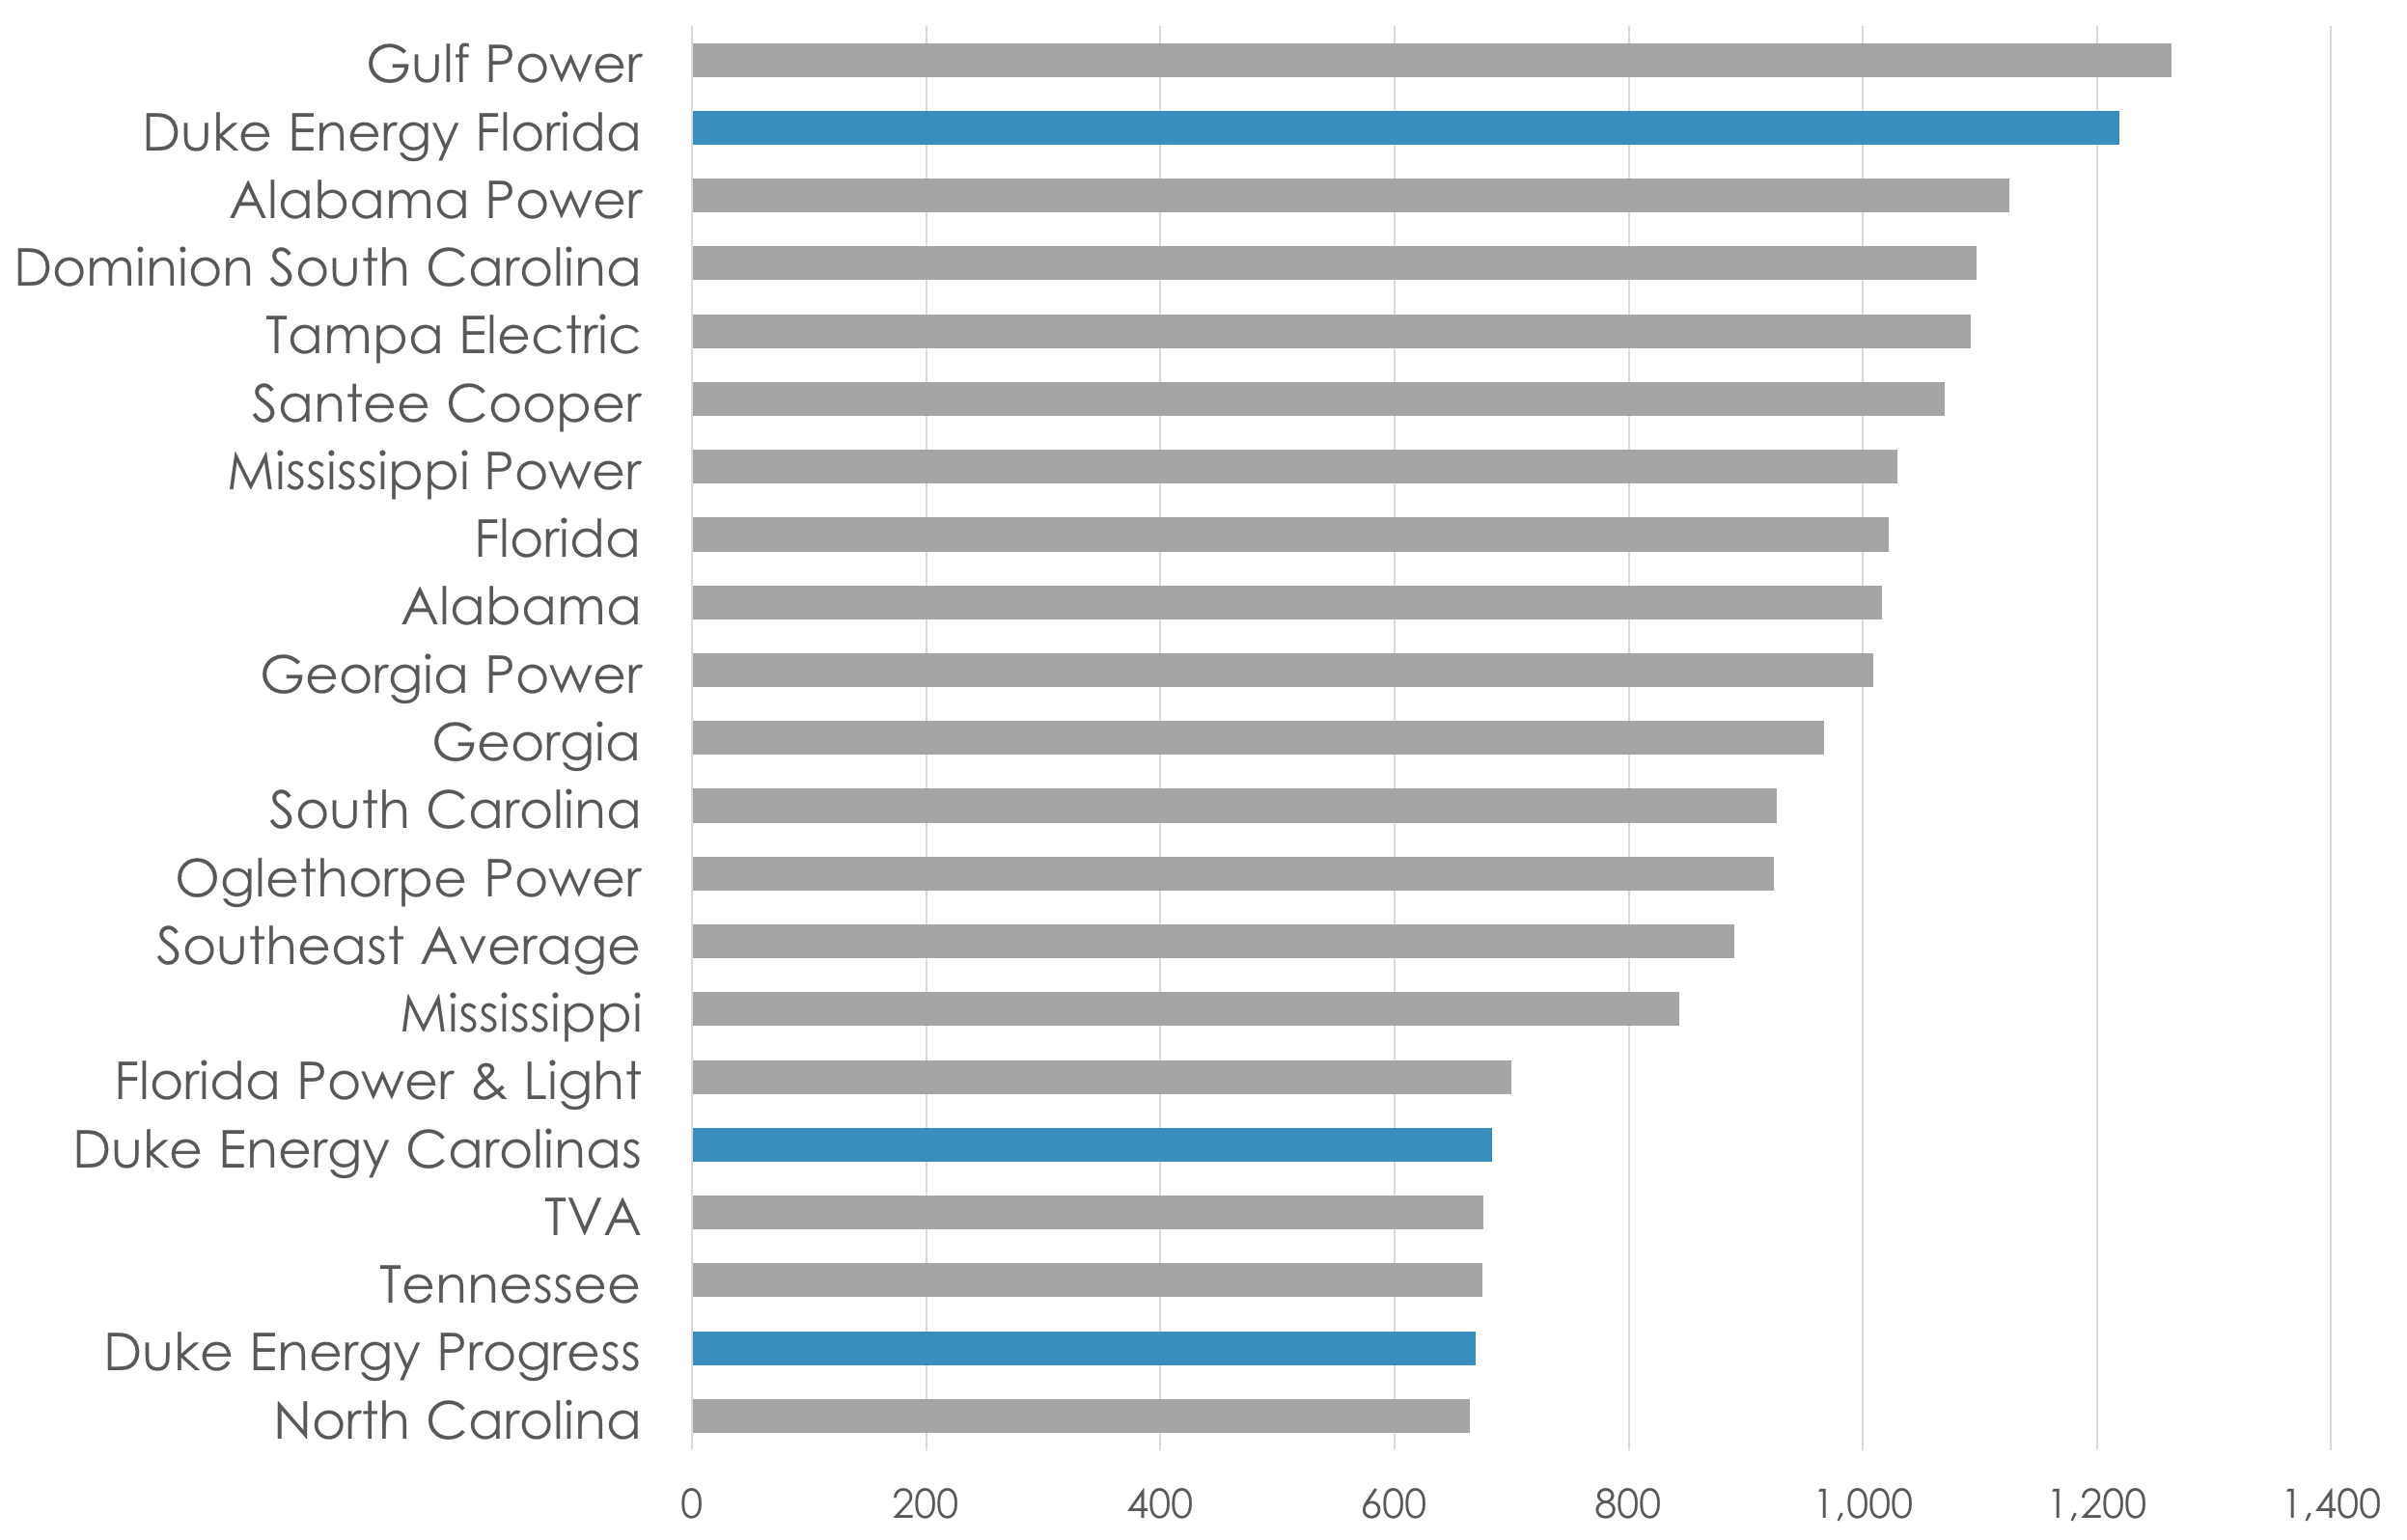
The relatively high emissions rate of Duke’s utility in Florida is unsurprising given that it uses coal and gas to meet approximately 95% of its generation needs. Unfortunately, Florida’s planning process results in resource mixes that rely heavily on fossil fuels.
In contrast, Duke’s utilities in the Carolinas have been consistently lauded as regional leaders in solar energy and energy efficiency. This is made possible by state leadership, particularly in North Carolina. For example, last year the North Carolina Utility Commission ordered Duke Energy to evaluate the potential to retire all of its coal plants and to describe its most current strategic plans to reduce carbon emissions, this in addition to other victories that SACE wrote about last year. Although the jurisdiction of the Commission is limited to North Carolina, the utilities file the same plans in South Carolina, so the impact is felt both states and reflected in the joint plans, which were filed last week on September 1st.
Timing matters: past and present plans take different approaches
In North Carolina, the full IRP process occurs every other year, meaning the last joint Duke Energy Carolinas and Duke Energy Progress IRP was filed in 2018 and we’re now starting the cycle over again in 2020. To get an idea of how much room for improvement Duke might have, let’s look at the emissions trajectory from our recent report, which shows the most recent utility plans at the time of writing, in this case, August 2020. Although Duke is on its way to meeting its interim goal of a 50% reduction by 2030 even with a business as usual approach, that isn’t saying much. Collectively, these plans show a pretty underwhelming trajectory for emissions reductions leading up to 2030.
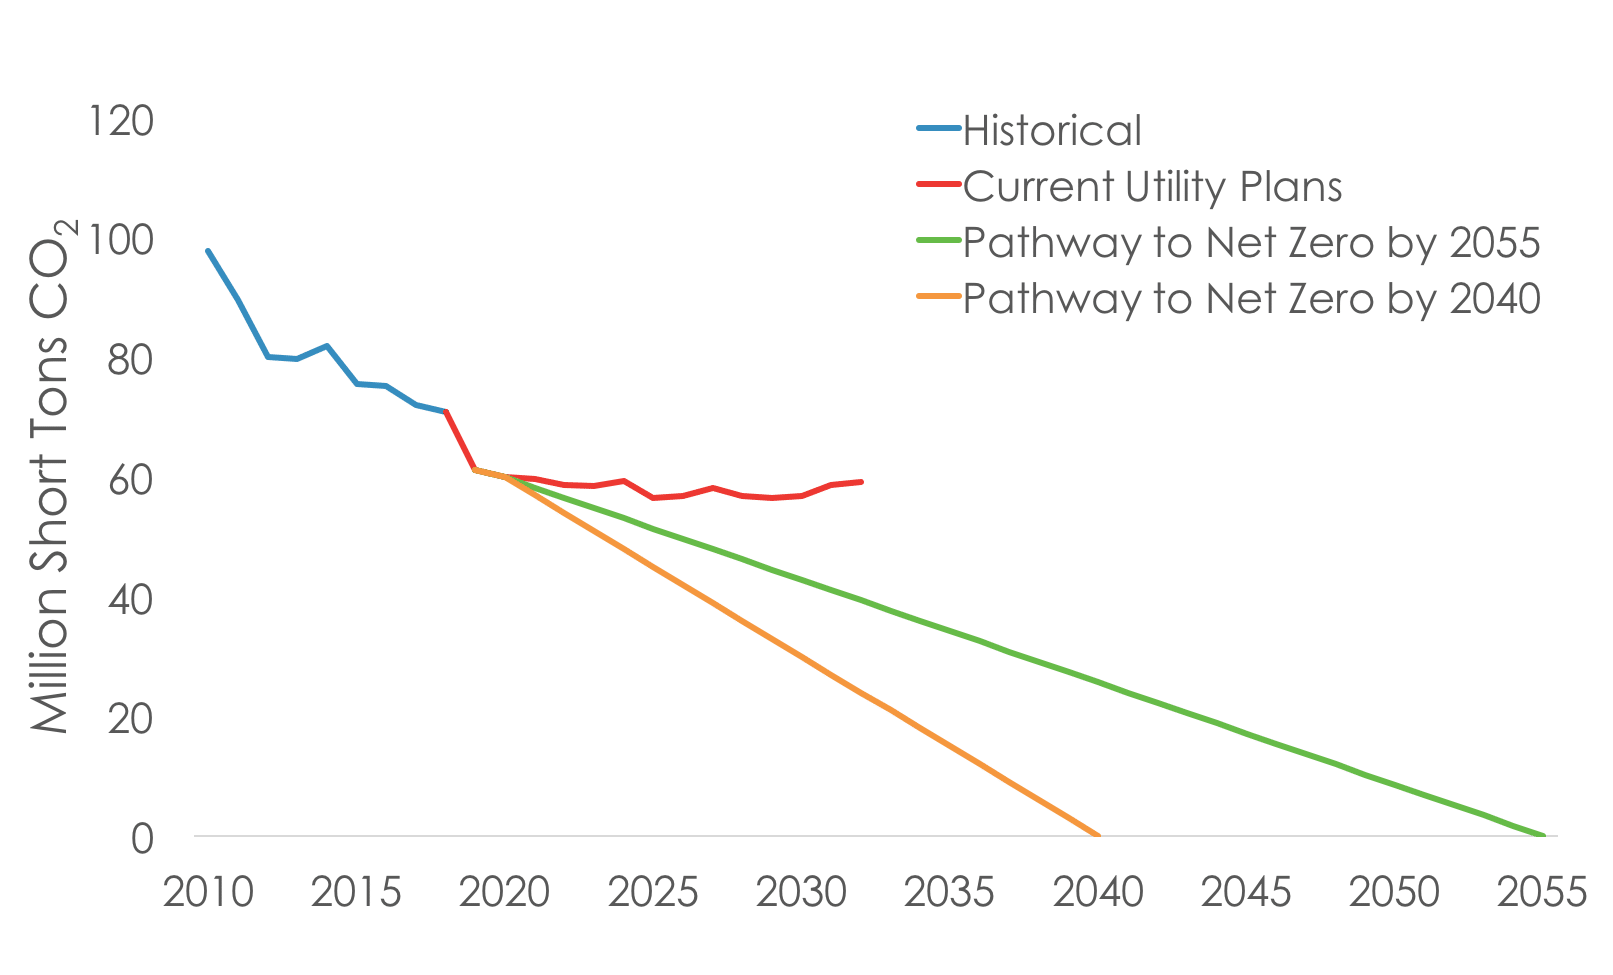
Without a significant departure from past IRPs, Duke is no exception to what we’ve stated multiple times in the past: utilities have a lot more work to do when it comes to decarbonizing. And while one would think that not much has changed since the last IRP, we’d also remind readers that it was one year ago that Duke established a net-zero by 2050 goal, and only two years ago that North Carolina signed its own emissions goal into law. A lot can change in a short period of time, and we hope that holds equally true for upcoming decisions in the IRP.
So what’s actually in the Duke IRP? If you want to boil it down to essentials, Duke has presented six different resource portfolios that are characterized by different levels of system carbon reductions (among other things).
- Pathway A: Base Without Carbon Policy
- Pathway B: Base With Carbon Policy
- Pathway C: Earliest Practicable Coal Retirements
- Pathway D: 70% CO2 Reduction: High Wind
- Pathway E: 70% CO2 Reduction: High SMR (Small-Modular Reactors)
- Pathway F: No New Gas
While each portfolio has different trajectories during the planning period, they all theoretically keep Duke on-track to meet its decarbonization goal, though not all meet North Carolina’s goal of a 70% reduction from 2005 levels by 2030. Two pathways (D and F) include substantial offshore wind additions, a technology that has been proven around the globe. The draft IRP also includes a pathway that relies on the installation of the unproven small nuclear reactor technology by 2035. In the filing, Duke writes: “All pathways included in the 2020 IRP keep Duke Energy on a trajectory to meet its carbon goals over the 15-year planning horizon.”
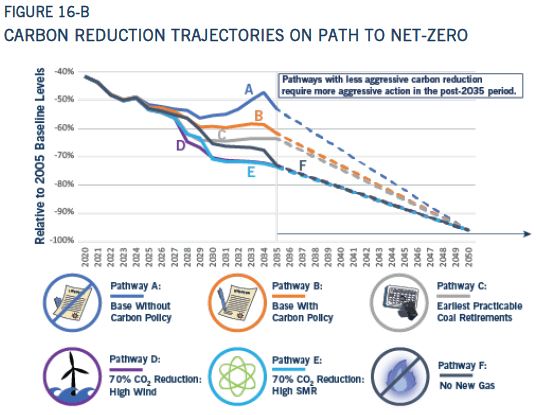
While the Duke filing says that all portfolios can lead to net-zero, we know that not all pathways are created equal. We don’t think that anyone truly believes that Pathway A, which shows an increase in emissions, is a practical way to reach net-zero, or that it will do an equally good job as pathways that show a consistent downward trend, such as Pathways D, E, and F. Still, based on what we’ve seen thus far, Duke doesn’t appear to be avoiding the issue of net-zero pathways altogether. And the fact that a utility IRP in the Southeast unambiguously associates its own resource plan with combating climate change is a major step forward both Duke and for the region. We are still in the early stages and don’t know how this IRP process will pan out. This IRP process is a chance for Duke to be an exception in the region, or continue more of the same.
Looking beyond the IRP
The timeframe leading up to 2040 to 2055 is critical. This is the time in which we need to get to net-zero global greenhouse gas emissions now to avoid the worst impacts of the climate crisis. Electric utilities in the Southeast have been falling short of the emissions reductions recommended by scientific guidance, and unless we see significant departures from ‘business as usual’ resource plans and proceedings, the Southeast will not be able to stand with the rest of the world in preventing the climate crisis. Hear from a NASA expert about how the climate crisis is making hurricanes more destructive. Duke says that all portfolios in the IRP keep the company on a trajectory to meet its carbon goals, but until we see these plans turn into action, their work is not done yet.
We’ll end this blog by saying that IRPs take a long time to review. Each utility filing is about 400 pages not counting attachments (which are similarly voluminous), so SACE will be digging into the filing’s assumptions related to the energy efficiency market, cost assumptions for carbon-free energy technologies, and the treatment of more niche issues like seasonal load forecasts. We will continue to blog about the Duke IRP and continue our series on utility decarbonization goals as we uncover more details. As readers wait, here is the closest video representation we could find of what’s going through our heads while reading the coal retirement analysis.
[button color=”blue” url=”https://bit.ly/SEEmissionsReport2020″]Download the Report[/button]
[button color=”blue” url=”https://cleanenergy.org/?s=SEEmissionsReport2020″]Read the Report Series[/button]
[button color=”blue” url=”https://cleanenergy.org/news-and-resources/webinar-tracking-decarbonization-in-the-southeast-2020-report/”]Watch the Webinar[/button]
#SEEmissionsReport2020
