A recent webinar with NASA Senior Scientist Dr. Timothy Hall explained how climate change is affecting hurricanes.
Chris Carnevale | June 16, 2020 | Climate Change, Extreme WeatherHurricane season starts June 1 and runs for a six month period when hurricanes typically occur in the Atlantic. And as we often do at the beginning of hurricane season, we thought it would be helpful to share information about how hurricanes are being affected by global warming.
To this end, we held a webinar on June 3 with Dr. Timothy Hall, Senior Scientist at NASA Goddard Institute for Space Studies and Adjunct Professor at Columbia University’s Department of Applied Physics and Applied Mathematics, who is an expert on the interactions between climate change and hurricanes. If you missed the webinar, please view the recording here.
So, what are the major effects climate change is having on hurricanes? Shown in the graphic below, the impacts are listed from the greatest to least degree of certainty that climate change–or population change in the case of point #1– is having an impact.
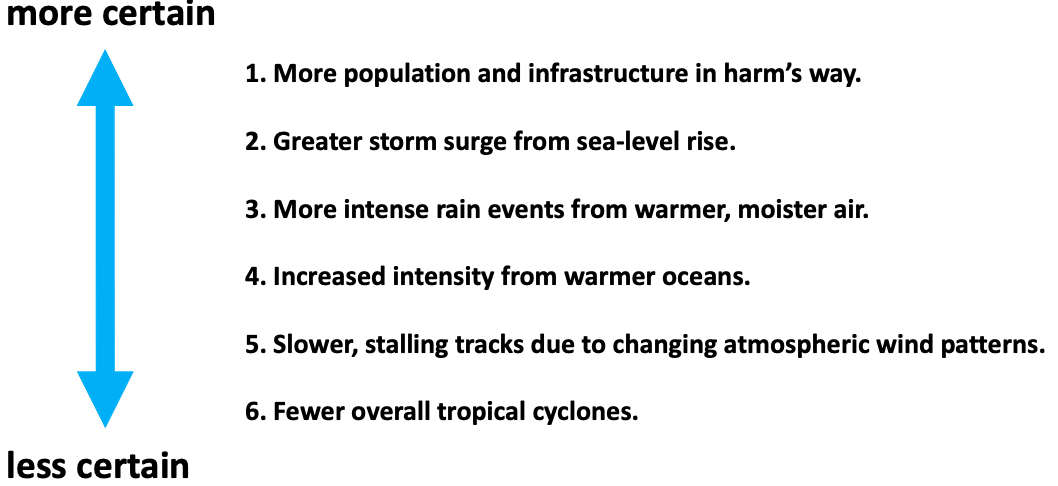
Dr. Hall laid out the six factors, listed below; the webinar covered primarily items 4 and 5.
1. More population and infrastructure in harm’s way.
Population growth is a result of many factors and at this time is not a climate change issue. Coastal populations are growing and the amount of coastal property and infrastructure is increasing, so year by year, more people and development are in harm’s way.
2. Greater storm surge from sea level rise.
As sea level rises due to global warming, the storm surge from hurricanes can push farther and farther inland and the depth of flooding is increased. The global mean sea level has risen about 8 inches over the past century, but climate change is increasing this rate of rise. In recent years, the rate of rise has more than doubled and it is expected that global sea levels will rise 1 to 4 feet–but potentially more–over the course of this century, depending on how aggressively we reduce carbon pollution. As sea levels rise, each storm pushes floodwaters higher than it would have without sea-level rise. For example, insurance giant Lloyds of London estimated that about 30 percent of the New York City area losses from Hurricane Sandy were attributable to just the historical observed sea-level rise. Other scientific analysis has estimated that just 8 inches of historic sea-level rise translated to an additional 83,000 additional homes in 27 square miles being hit by Sandy. Put another way, the damage from Hurricane Sandy in New York City would have been 30 percent less and tens of thousands of homes would have been spared from flooding in the absence of sea-level rise.
3. More intense rain events from warmer, moister air.
As the air warms due to greenhouse gas pollution, it holds more moisture. This translates into more rain during a hurricane, meaning more hazardous flooding.
4. Increased intensity from warmer oceans.
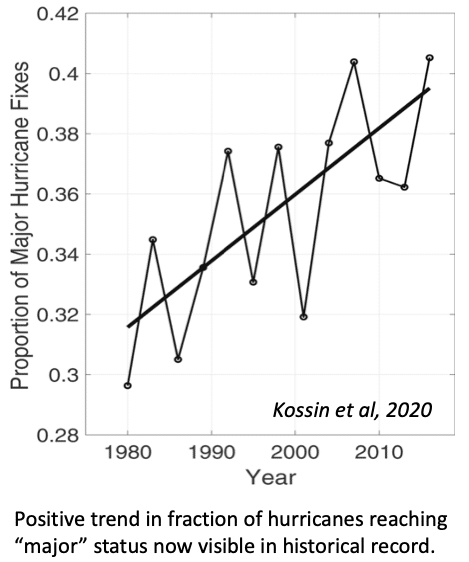
Oceans absorb most of the planet’s increased heat due to greenhouse gas emissions and as the oceans warm, they interact with the atmosphere to essentially provide extra fuel for hurricanes. This extra fuel means that hurricanes are more likely to become major hurricanes (category 3 or higher). While this trend used to be just in models of future impacts, it is now evident in the historical record as well. A recent study by James Kossin, an atmospheric research scientist with NOAA, demonstrates that the historical record shows that a greater proportion of hurricanes are reaching major hurricane status, which is depicted in the graph below.
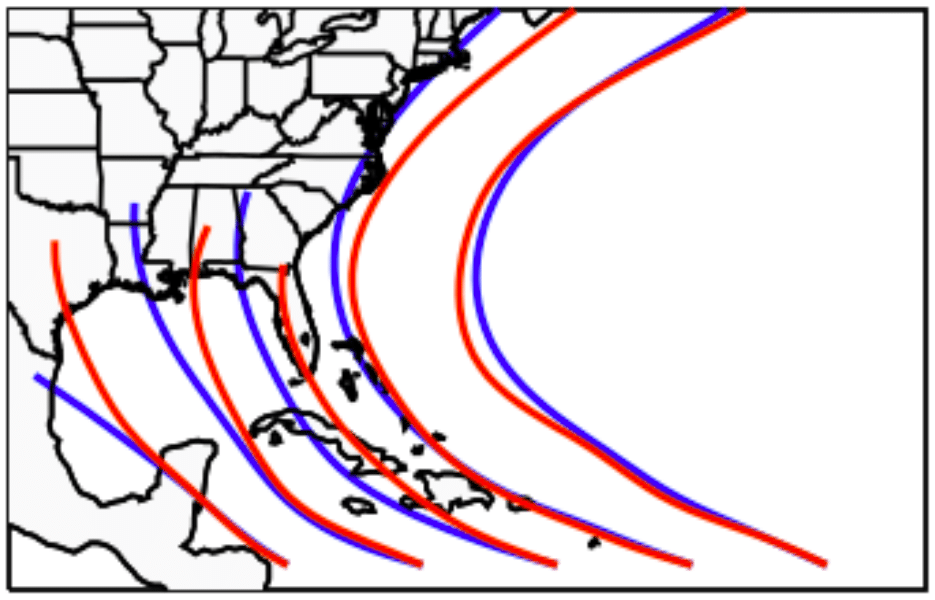
In addition to ocean warming affecting hurricane intensity, it is also impacting where storms form and where they go. In one of Dr. Hall’s recent studies, he found that the starting places and the tracks of North Atlantic hurricanes are shifting eastward. This means that some places in the U.S. will be less likely to be hit by a hurricane than they historically have been, while others will be more likely to be hit. You can see in the map below from Dr. Hall’s study, the blue lines are where a storm would have gone historically and the red lines show where the storm would go in the future, in the 2030s.
Looking at it another way, the map below shows regions that are less likely to be hit by a category 4 or 5 hurricane in the 2030s (shown in blue) and regions that are more likely to be hit (shown in orange and red).
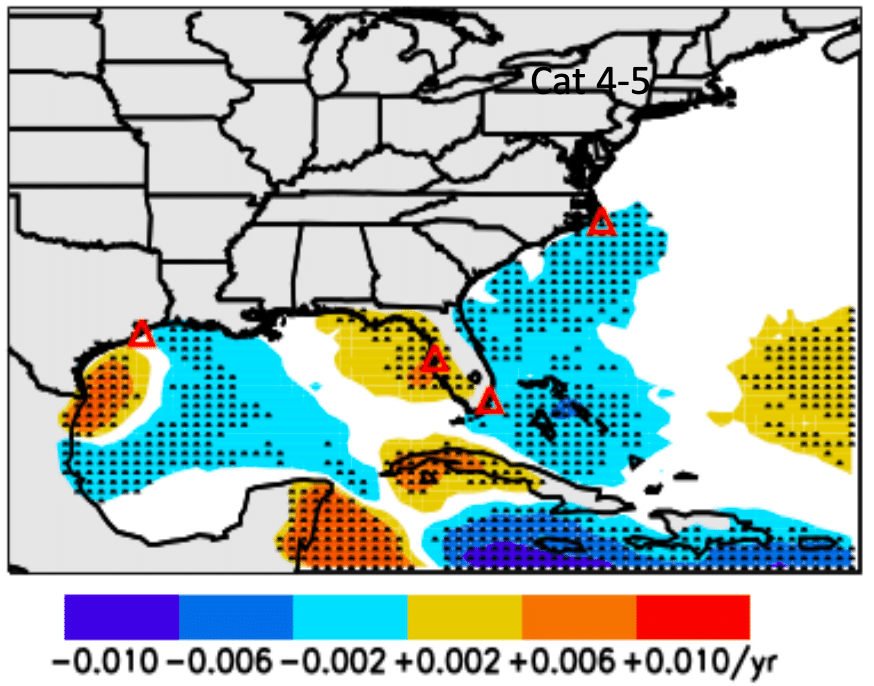
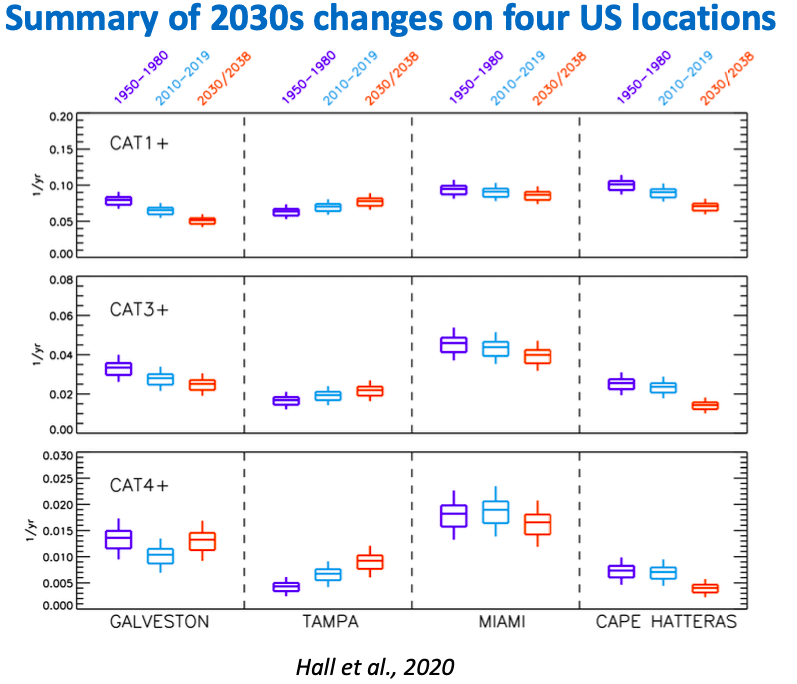
Below is a summary of how the changing factors of hurricane intensity and tracks are affecting landfall rates for several coastal locations. You can see how the vulnerability of the Tampa Bay area and Florida’s Gulf coast is particularly concerning.
5. Slower, stalling tracks due to changing atmospheric wind patterns.
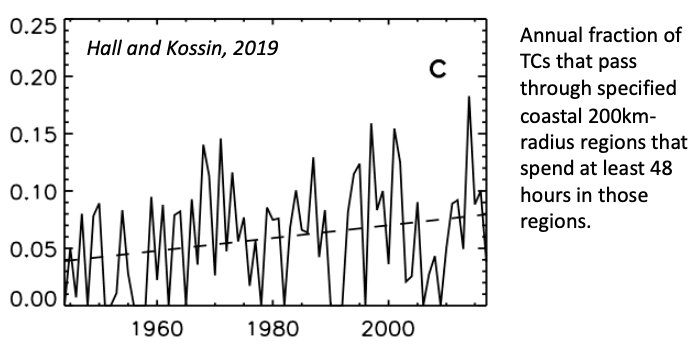
Changing atmospheric wind patterns are causing some hurricanes to slow down and stall along their path. This trend was apparent with recent storms like Florence, Dorian, Imelda, and especially Harvey. A study by Dr. Hall and Dr. Kossin found that while the average speed of hurricane movement is slowing down, it is not that all storms are slowing down a little bit, but rather that a fraction of storms are just completely stalling sometimes. The chart below from their study shows that the number of historic hurricanes spending 48 or more hours in a single location along the coast has been increasing.
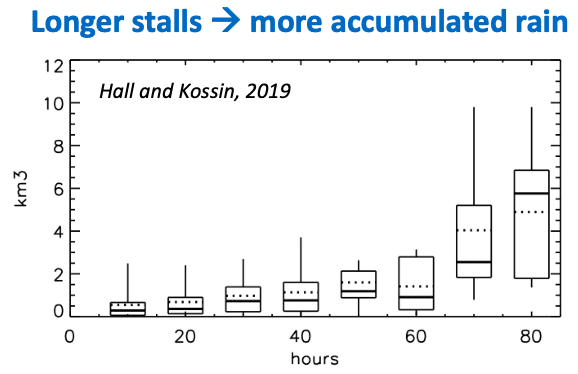
The longer a hurricane stalls over a certain area, the more water it drops there, which means more flooding. This concept is demonstrated in the chart below, which depicts data from historic storms showing the number of hours a storm sits over a certain area (on the x-axis), and the amount of rain dropped on the area (on the y-axis).
6. Fewer overall tropical cyclones
As the climate changes, it is projected that the overall number of hurricanes will decrease. This is a good thing, however, due to the increasing strength of hurricanes and the increasing likelihood that hurricanes will become major hurricanes, the total damage done by hurricanes is actually projected to increase nonetheless.
For a greater explanation of these concepts, please watch the recording of the webinar, which you can find here, and see our archive of blog posts about extreme weather here.