The structure of this year’s “Solar in the Southeast” Report may look very familiar; the format is the same. We take a look back at last year (2020) and a four-year forward forecast to 2024.
[button color=”blue” url=”https://secure.everyaction.com/x8kw1Sh8jkCrsgLXK-b6-w2″]Download the Report[/button]
[button color=”blue” url=”https://cleanenergy.org/news-and-resources/solar-in-the-southeast-report-webinar/”]Watch the Report Webinar[/button]
[button color=”blue” url=”https://cleanenergy.org/?s=%23SSR2021″]Read the Report Blog Series[/button]
As usual, there are a number of interesting storylines in this year’s report. With this first blog in the companion series, I will highlight a few:
FORECAST FOR SOUTHEAST STATES
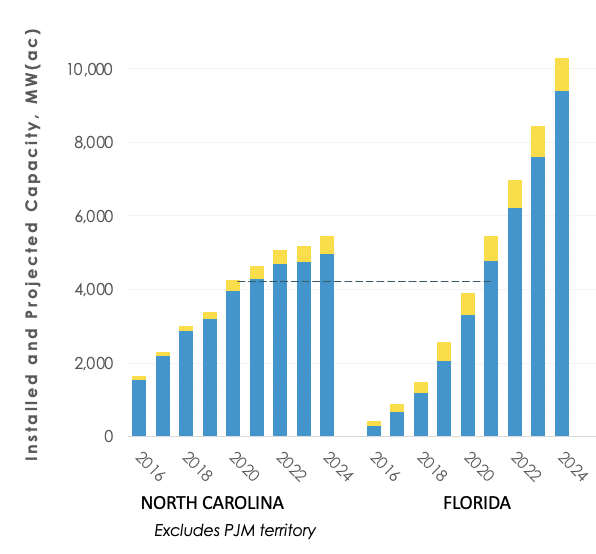
Florida is now surpassing North Carolina
We have been observing this convergence for several years and had predicted that Florida would overtake North Carolina in installed capacity this year (2021). The new report actually shows that Florida came up just short in 2020 with 3,909 MW compared to North Carolina’s 3,955 MW on a full-year operational equivalent basis. But with the trajectories of the two states, we can confidently state that the transition has already been accomplished in the first months of this year. (Note that the capacity installed in North Carolina is slightly higher, but approximately 7% serves customers in South Carolina instead.)
South Carolina caught North Carolina, as well
While the “Sunshine State”’s solar expansion may not be surprising, the “Palmetto State”’s growth has been a bit more stealthy. SACE uses a watts per customer solar ratio to compare/contrast states and utilities across the region. In fact, that’s the primary metric for our reporting. On that metric, South Carolina has been quickly catching up to North Carolina and since the beginning of 2021, has now taken the lead with the highest watts per customer solar ratio in the Southeast.
POLICIES BEHIND THE PERFORMANCE
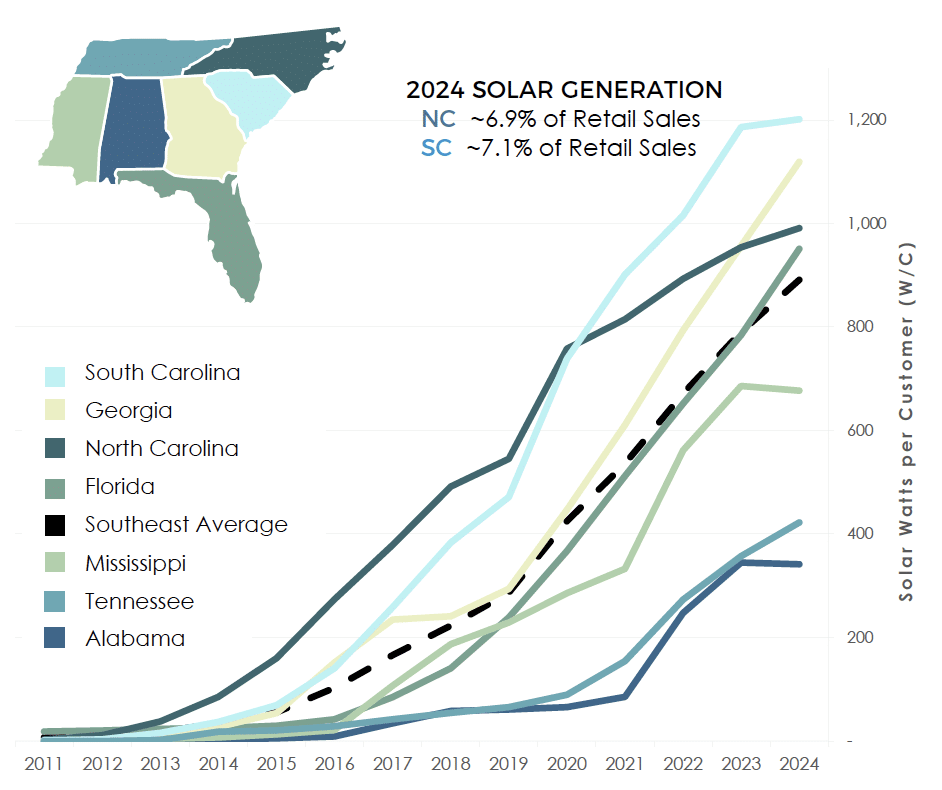
SACE now forecasts Georgia to surpass North Carolina, too
This was not evident in last year’s report, but as Georgia utilities complete projects currently in the pipeline, the state will also exceed the solar penetration of North Carolina within our four-year forecast time horizon. In the case of Georgia, that will apply to both the solar ratio (watts per customer) and also total installed capacity.
Pandemic disproportionately impacted distributed solar
Growth in this small-scale market segment that includes rooftop solar was essentially the same as the prior year (~300 MW) – but we had been anticipating more. SACE forecasts have been recalibrated to reflect the pandemic. Utility-scale solar, on the other hand, experienced much less impact and achieved the highest year-on-year growth to date (~3,700 MW).
SOUTHEAST SOLAR MOMENTUM: SUNRISERS
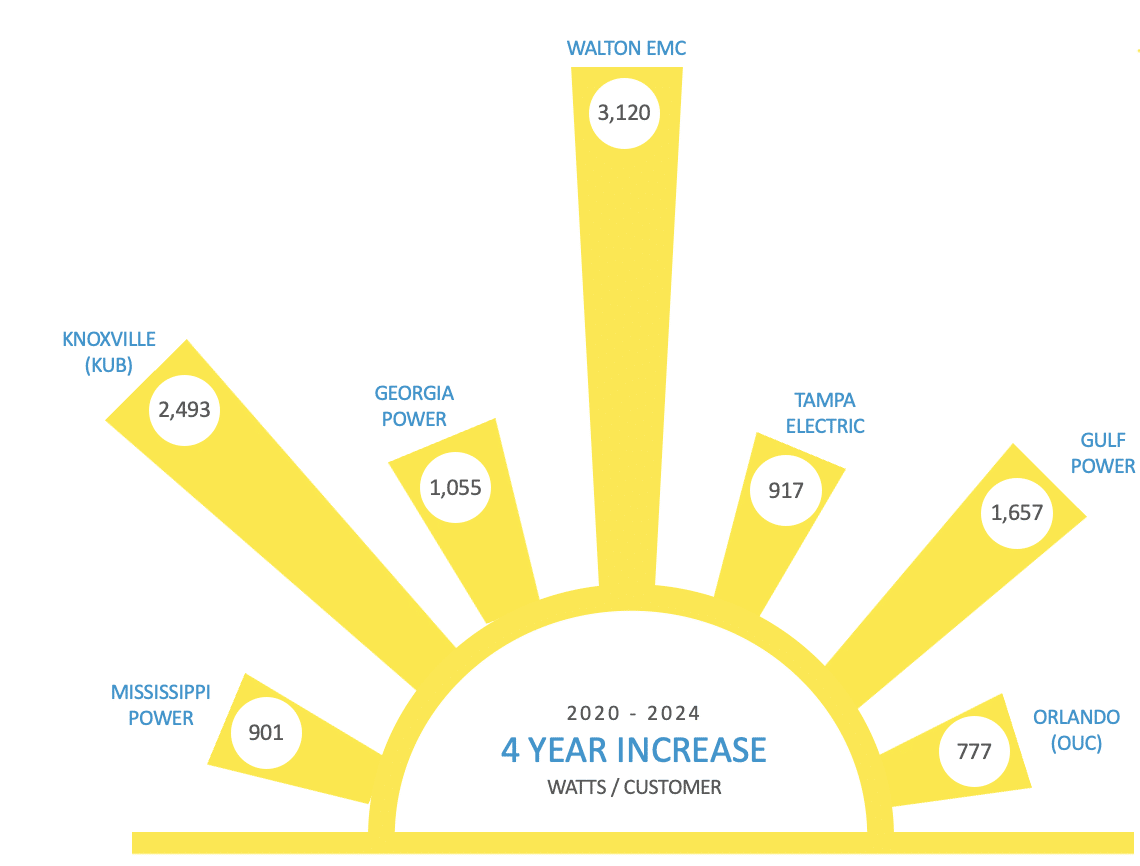
New SunRisers
Knoxville Utilities Board (KUB) burst onto the scene with 502 MW of solar contracts through the TVA “Green Invest” program. With a customer base just a little over 200,000; SACE forecasts KUB to have 2,552 watts per customer in 2024. Similarly, two 78.5 MW projects were recently approved that will interconnect on the Southern Company system and effectively double the solar ratio for Mississippi Power by 2024.
New SunBlocker
Alabama Power is no longer expected to commission the full capacity of solar approved by the Public Service Commission in 2015. The SACE forecast for Alabama Power in 2024 has dropped to 327 watts per customer. Since the Southeast region average was already above that level last year (2020), Alabama Power joins the North Carolina Electric Cooperatives in meeting the categorical definition as SunBlockers.
WHAT’S NEXT? Accountability/transparency for contract claims
One of the things that became obvious in assembling this year’s dataset is that more projects are being commissioned across state lines from the customers they will serve. This isn’t entirely new. We have had the following example in our Methods since we began this annual reporting process: “a solar project in Alabama contracted to the Tennessee Valley Authority (TVA) will proportionally serve customers in multiple states across TVA service territory.” But more than half of the solar contracted to KUB (Knoxville/TN) is being developed in northern Mississippi (270 MW out of 502 MW total). General Motors has commissioned 100 MW in Mississippi and another 28 MW in Kentucky to serve its Spring Hill, TN factory. Because of the hype surrounding these announcements, the local host communities may have the misperception that they will be served by these new clean energy resources.
The contractual relationships, however, seem to indicate that TVA is instead allocating those renewable attributes to their Green Invest customers, leaving behind just “null power” electrons for those host communities. Various organizations (the Federal Trade Commission/FTC Green Guides, Green-e, Greenhouse Gas Protocol, etc.) have guidelines for these types of transactions. SACE believes the increasing prevalence of these contractual relationships across state lines may warrant additional scrutiny to ensure proper accounting and transparency.
Subsequent blogs in this series will unpack some of these and potentially other observations. If you have questions about any of the content in the report, I encourage you to email me at bryan@cleanenergy.org, as these questions may be helpful to address in upcoming blogs.
[button color=”blue” url=”https://secure.everyaction.com/x8kw1Sh8jkCrsgLXK-b6-w2″]Download the Report[/button]
[button color=”blue” url=”https://cleanenergy.org/news-and-resources/solar-in-the-southeast-report-webinar/”]Watch the Report Webinar[/button]
[button color=”blue” url=”https://cleanenergy.org/?s=%23SSR2021″]Read the Report Blog Series[/button]
#SSR2021


