


Another trip around the sun. Solar in the Southeast reached a significant milestone and others emerged on the horizon. The third Solar in the Southeast annual report examines these stories and more.

Download the Report Watch the Webinar Read the Report Blog Series
By the Numbers
- Seven states
- 400 utilities
- 30 million customers
- 800 solar projects
- 10,000 megawatts (MW) of solar
- 325 watts per customer (W/C) (Southeast Average)
To provide an equitable, unbiased comparison of various-sized utilities throughout the Southeast, SACE ranks utilities and states on the basis of watts per customer (W/C) of solar power. This has become our primary metric and, as indicated above, the Southeast Average for 2019 was 325 W/C. The report illustrates which states and utilities are above and below that mark.
SACE began producing annual Solar in the Southeast reports two years ago. One of the projections from the first report was, “The region will have over 10,000 MW by 2019 — and approximately 15,000 MW by 2021.”
On a full-year operational equivalent basis, SACE attributed 9,622 MW for the calendar year 2019, and by the end of 2019, the Southeast had indeed achieved that major milestone: installed capacity of more than 10,000 MW.
Forecasts keep increasing. SACE reports on a four-year forward time horizon and, in that first report, we projected solar at just over 15,000 MW for 2021. In the span of just two years, the initial 15,000 MW forecast has leaped to over 17,000 MW.
Our forecast period now extends to 2023, reflecting a doubling of the 2019 capacity for 2022 (i.e., exceeding 20,000 MW) and then nearly 25,000 MW for 2023. We expect that to be the first year the region exceeds 10% of its capacity (and 5% of generation) from solar.

Other Observations from the Forecast Period
Florida will surpass North Carolina on total installed solar capacity even sooner than expected. We are now projecting the Sunshine State to overtake the Tarheel State in 2021.
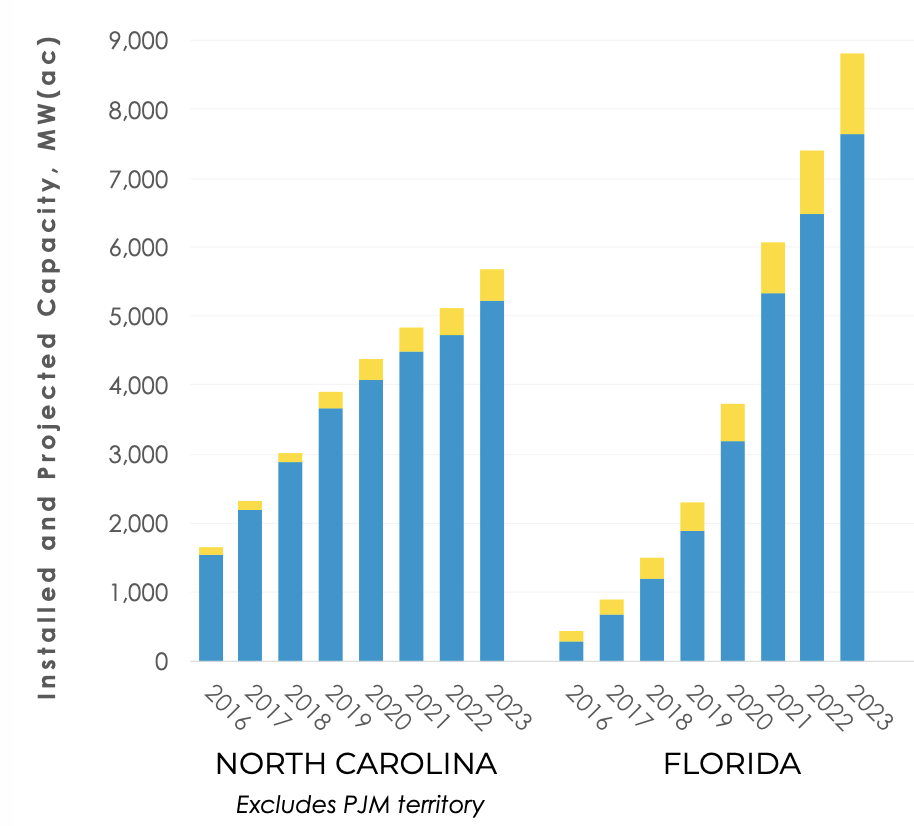
We are also projecting that South Carolina will overtake North Carolina on solar watts per customer in 2021.

Leaders Continue to Lead
The perennial leaders deserve recognition for their consistency:
Duke Energy Progress remains atop the current and future leaderboard for the third consecutive year.

This Duke subsidiary, along with Tampa Electric and Dominion Energy South Carolina (DESC) (former SCE&G), has been on our SunRiser list all three years of our annual report.
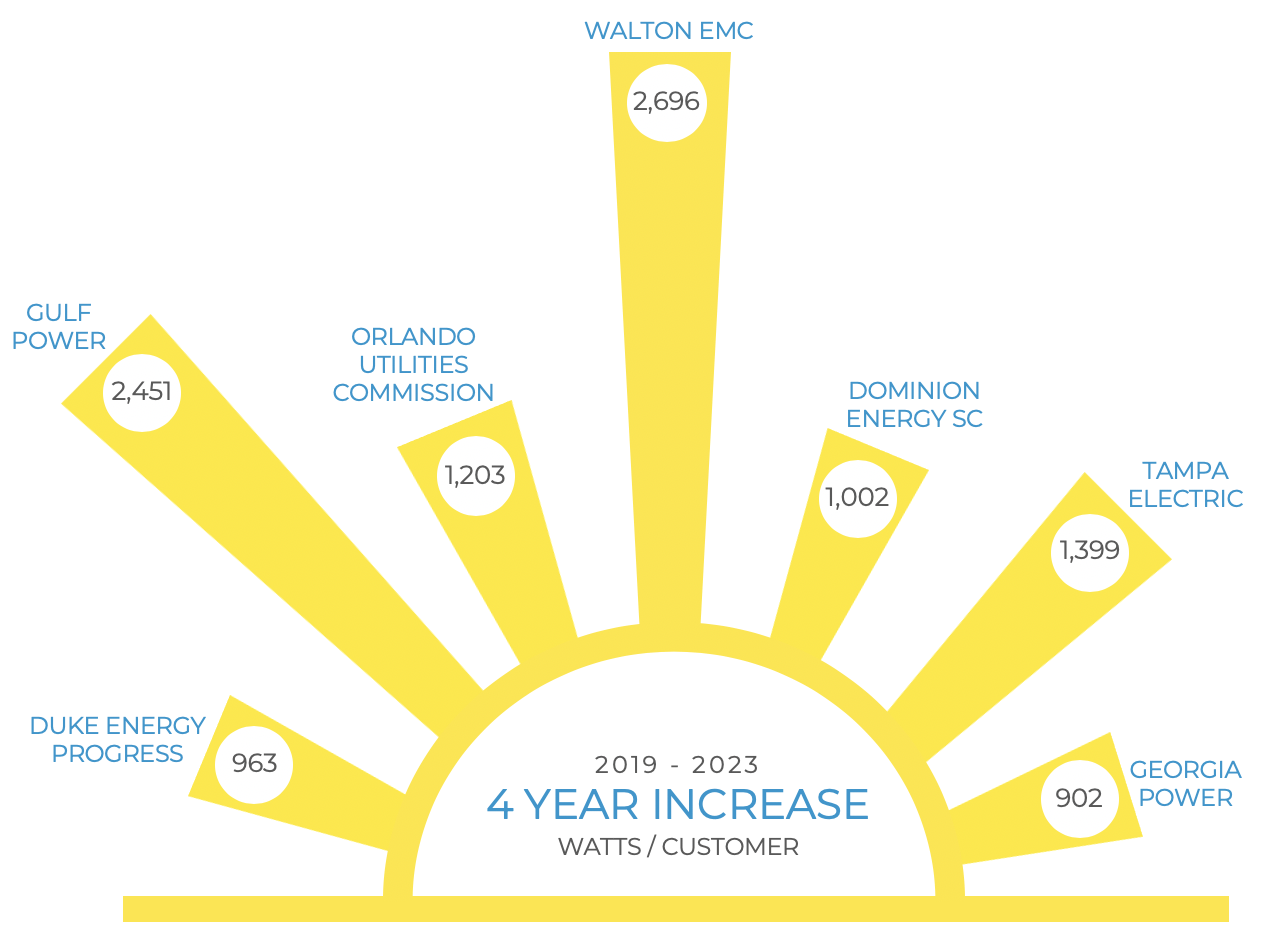
A Newcomer Emerges
Gulf Power made its debut on the SunRiser list as sister-company Florida Power & Light (FPL) shifted some of the planned solar development for the next four years into the Florida panhandle.
SunRisers are the utilities that demonstrate the highest solar ambition (measured as the increase in their W/C solar ratio over the four-year forecast period).
Laggards Continue to Lag

Policies Behind the Performance
Legislative, regulatory, and utility policies vary considerably across the Southeast. These either spur or stifle solar growth.
Favorable examples include:
- Energy Freedom Act in South Carolina,
- Public Service Commission (PSC) decisions in Georgia, and
- Utility innovation in Florida – most notably, the SolarTogether program (1,490 MW) from FPL that will double the amount of community solar in the United States and includes a low-income aspect.
Adverse policies continue to emerge from the Tennessee Valley Authority (TVA), like sunsetting the once exemplary Green Power Provider program. Additionally, this self-regulated monopoly utility, not subject to federal or state regulatory oversight, promoted a false narrative around its plan to imply significantly more solar than it intends to adopt.
In subsequent blog posts, I will unpack some of these observations with a more detailed analysis. If you have questions about any of the content in the report, I encourage you to email me at bryan@cleanenergy.org, as these questions may be helpful to address in upcoming blogs. Read more about solar in the Southeast on our website, cleanenergy.org/solar.
[button color=”blue” url=”https://bit.ly/SESolarReport2020″]Download the Report[/button]
[button color=”blue” url=”https://cleanenergy.org/news-and-resources/webinar-solar-in-the-southeast-report/”]Watch The Webinar[/button]
[button color=”blue” url=”https://cleanenergy.org/?s=ssr2019″]Read the Report Blog Series[/button]
#SSR2019


