The newest edition of the U.S. annual wind energy report shows growing promise for land-based wind energy to benefit the Southeast.
Chris Carnevale | August 31, 2021 | WindThe U.S. Department of Energy (DOE) released its 15th annual wind technologies market report yesterday, documenting many technological and economic trends and providing a comprehensive look at the state of the land-based wind energy market in the United States in 2020. In tandem with this report release, DOE also released its annual offshore wind market report, which we will examine in our next blog post in this series.
The report shows that wind energy has made major leaps and bounds in providing clean energy for Americans while keeping power costs low and providing health and climate benefits–trends that are poised to continue as the technology improves even more. Here are 8 main takeaways from the land-based wind report and what they could mean for the Southeast.
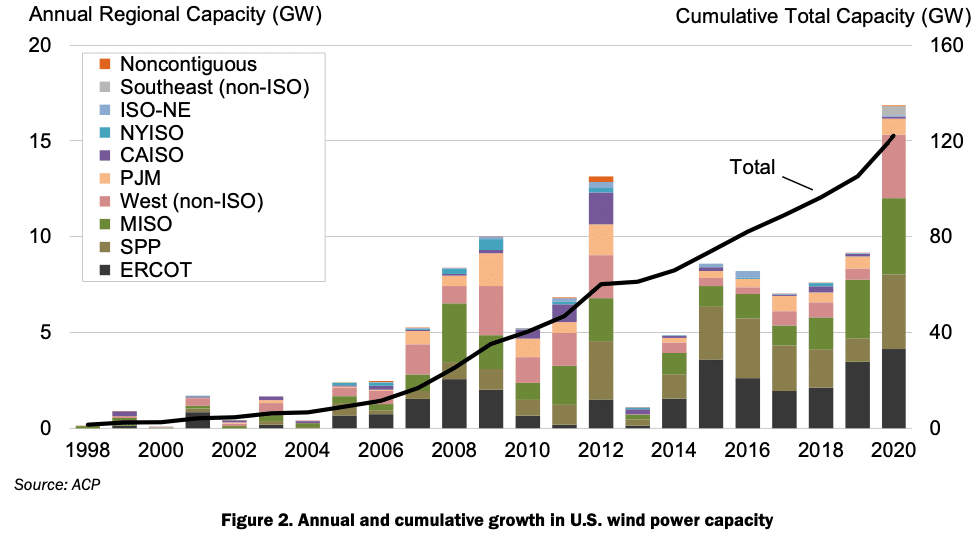
1. 2020 was a record-breaking year for wind energy installation.
In 2020, 16,836 megawatts (MW) of new wind energy capacity were installed, representing well over a tenth of the roughly 121,985 MW of cumulative capacity that have been installed in the U.S. over the past 20+ years. The capacity additions last year generated $24.6 billion of capital investment. Most of this development occurred in the middle part of the country, with none in the Southeast.
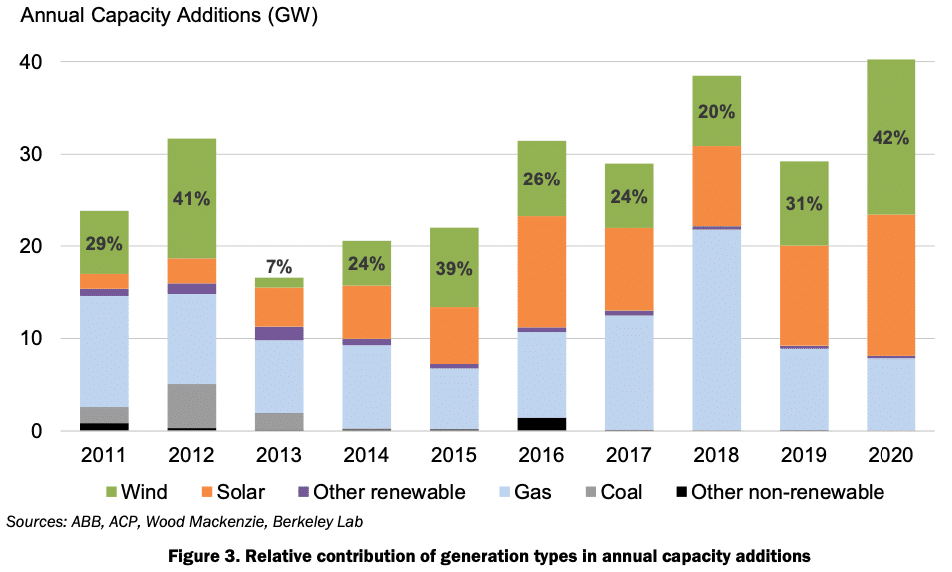
2. Wind energy was the number one source of new electric generating capacity across the country in 2020.
Wind energy represented 42% of new electric generating capacity built in 2020, beating out both solar and gas.
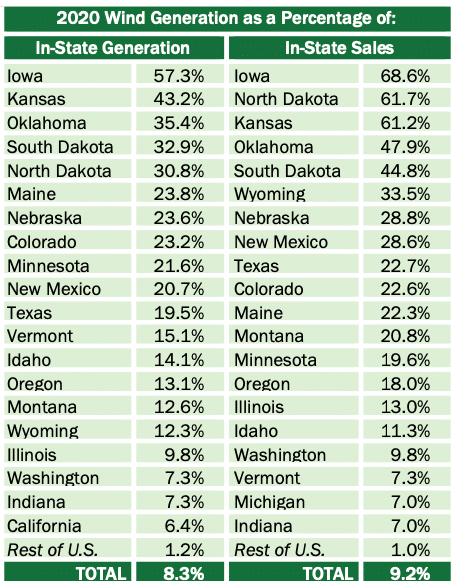
3. Wind energy is meeting the majority of power needs in several states.
Midwest states are getting very high penetrations of renewable energy through wind energy, with wind providing the majority of in-state electricity sales in Iowa (68%), North Dakota (62%), and Kansas (61%). This demonstrates that U.S. grid systems are operating reliably with high penetrations of variable generation, even without large amounts of energy storage.
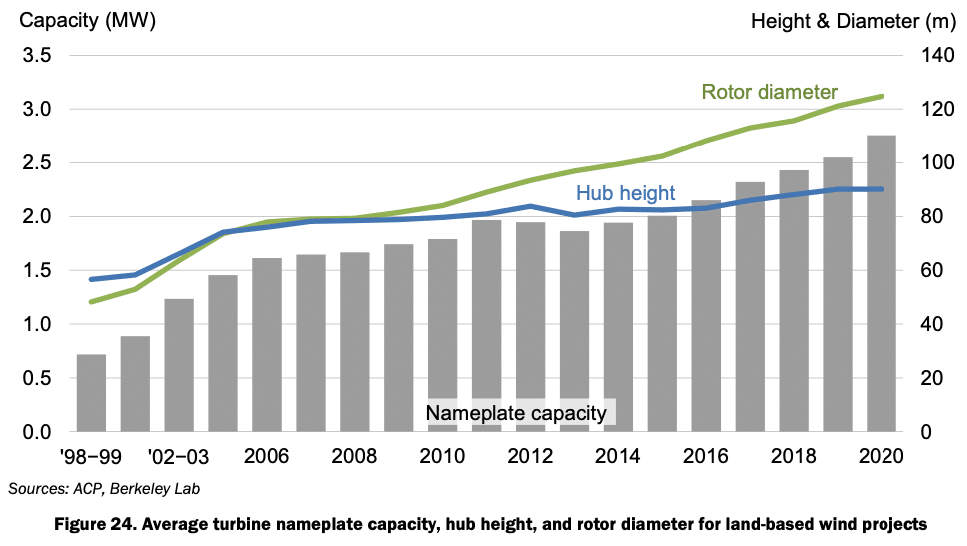
4. Wind turbines continue to get bigger and produce more power.
New turbines’ rotor swept area is increasing with longer blades and reaching wind high off the ground. The rotor area of the average turbine installed in 2020 was 125 meters, up from 103 meters in 2015. Access to higher and better winds is also being achieved with taller towers. The hub height of the average turbine installed in 2020 was 90 meters, up from 82 meters in 2015. Towers greater than 100 meters tall grew from 0% market share in 2017 to 15% in 2020. As the blades have gotten longer and the rotor diameter has increased in recent years, the average nameplate capacity of wind turbines installed has grown: in 2020 the average turbine installed was rated 2.75 MW, compared to 2 MW in 2015. These trends are particularly significant for potential wind energy development in the Southeast: large rotor turbines and longer turbines, with the ability to reach higher wind resources, were designed for locations with lower wind speeds than those in more wind-rich regions. Since the Southeast does not have as strong an onshore wind resource as much of the rest of the country, taller, larger turbines will be key to unlocking wind development. As turbines have increased in size, so too has their capacity factor when looking at the long-term trends. Capacity factors of projects built in 2019 (excluding 2020 installations because a full year of data wasn’t available yet upon report writing) averaged nearly 42%, with a range of 24% to 56%. For comparison, in 2010, the average capacity factor was about 30%. Given the relatively weaker wind resource in the Southeast than many other places in the country, the capacity factor of the single wind farm in North Carolina is 30%.
5. Hundreds of megawatts of wind energy were added to the grid interconnection queue in the Southeast in 2020.
The interconnection queue, where energy projects must apply to be connected to the grid, is up to more than 2,000 MW of land-based capacity in the Southeast, with 417 MW added last year. The interconnection queue can give an idea of developer interest in projects, but only about a quarter of projects that get in the queue end up getting built in the end. The 2,000+ MW of wind in the Southeast queue is dwarfed by solar (~57,000+ MW) and gas (~39,000 MW), but still represent a very large increase compared to 2010, when there was 0 MW of wind in the queue.
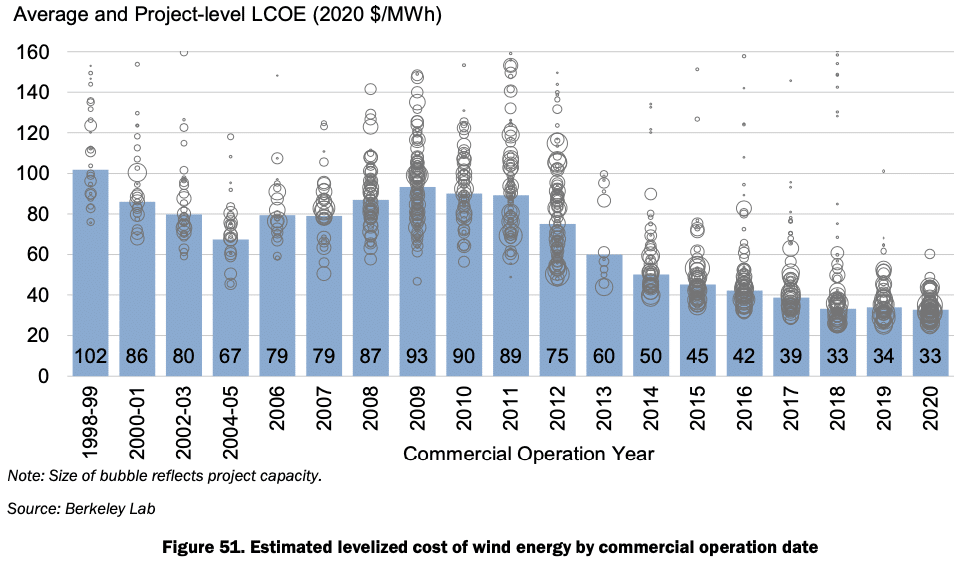
6. The cost of land-based wind energy remains very low.
The levelized cost of wind energy, which excludes any incentives or tax credits, is around $33/megawatt-hour (MWh) or 3.3 cents per kilowatt-hour (kWh) on average across the country. After including tax credits other incentives or revenue streams, the average delivered price of wind energy from projects that came online in 2020 was $29/MWh on average, which was actually an increase from 2019’s average price of $24/MWh. The cost of wind energy varies by region, with some regions’ wind costing more and some costing less.
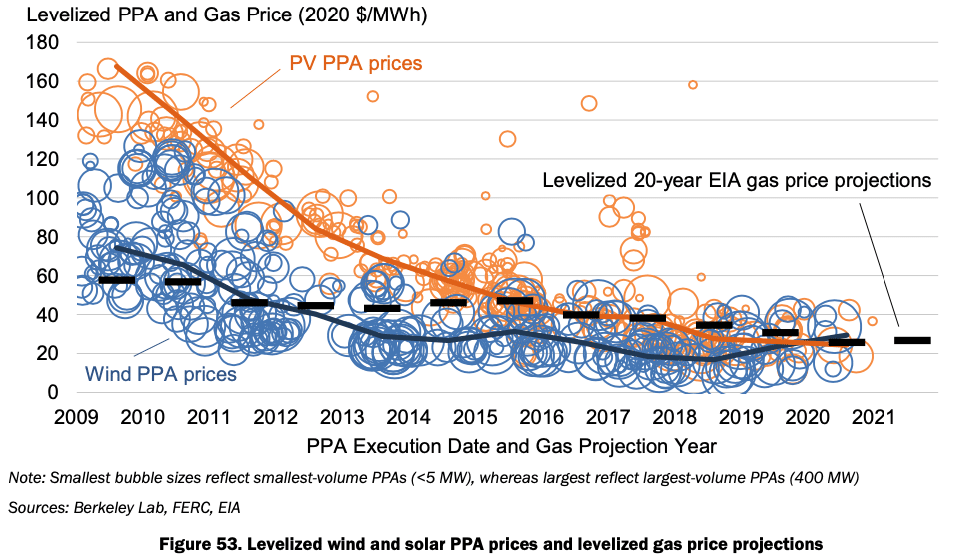
7. The price of wind energy is competitive with just the projected fuel cost of gas plants.
For most of the last decade, the average delivered cost of wind energy has been cheaper than just the 20-year projected fuel cost of operating existing gas plants, let alone the construction or other operations costs of the gas plants. Solar has also become cheaper than projected gas fuel costs in recent years. Looking forward, the cost of wind energy remains competitive and looks favorable to the 20-year fuel cost of gas. Power purchase agreement (PPA) pricing for wind energy has varied by region, similar to the regional differences in levelized cost of energy for wind.
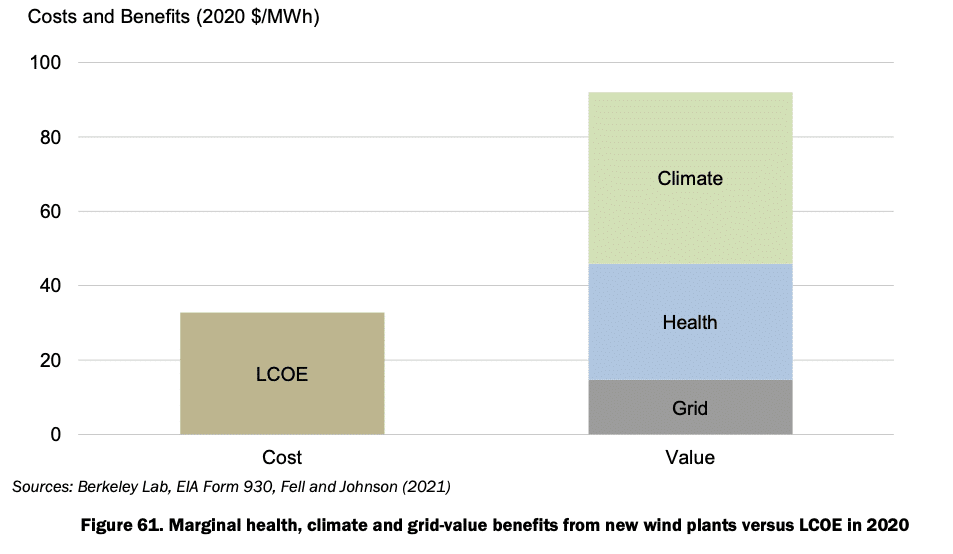
8. The health and climate benefits of wind energy are much larger than its cost.
Wind energy can offset polluting fossil energy and avoid public health and environmental costs, worth an estimated $76/MWh on average, which is more than double its average levelized cost ($33). Adding in the value to the grid of wind energy makes its benefits on average about 3 times its average cost.
The capabilities and attributes of wind energy shown in this report help explain why we at the Southern Alliance for Clean Energy are strongly supportive of wind power as a clean energy resource. We will continue to share information about and advocate for clean wind energy, both in-region development and transmission in from out-of-region.