 [button color=”blue” url=”https://cleanenergy.org/wp-content/uploads/22Solar-in-the-Southeast22-Fifth-Annual-Report-July-2022.pdf”]Download the Report[/button] [button color=”blue” url=”https://cleanenergy.org/?s=SSR2022/”]Read the Blog Series[/button] [button color=”blue” url=”https://cleanenergy.org/news-and-resources/solar-in-the-southeast-fifth-annual-report-webinar/”]Watch the report webinar[/button]
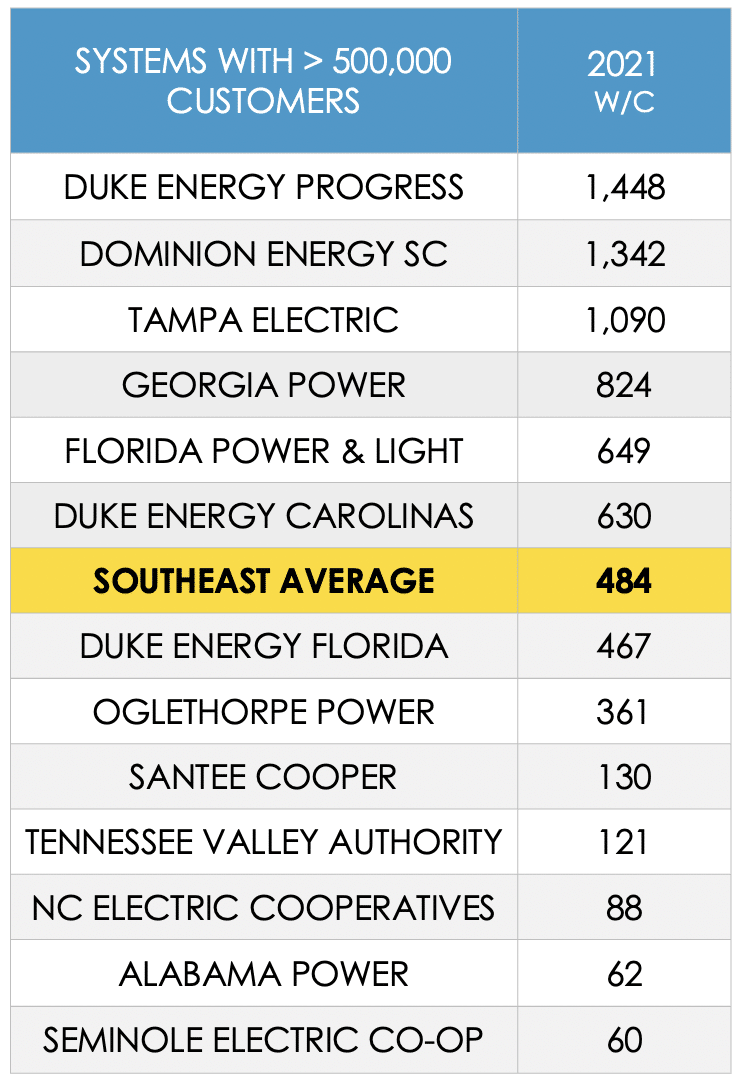
The 13 largest utility systems in the Southeast each serve more than 500,000 retail customers and, collectively, they serve more than 75% of Southeast customers. That’s why page 6 from the report is so important.

Current Results
The top four Southeast utility systems on the leaderboard remained unchanged in 2021. Duke Energy Progress (DEP) and Dominion Energy South Carolina (DESC) are followed by Tampa Electric and Georgia Power. Florida Power & Light (FPL) moved into fifth place on this ranking which is compiled using our primary metric: watts per customer (W/C). This enables a fair, unbiased comparison across utilities of all sizes.
Perhaps even more interesting is to consider how these rankings have evolved over the five years SACE has been reporting them.
DEP has held the top slot on this list in all five of our reports.
Duke’s other utility in North and South Carolina, Duke Energy Carolinas (DEC) was #2 in our first annual report. Then, despite an acquisition that changed the name of South Carolina Electric & Gas (SCE&G) to DESC, that utility has been #2 in each one of the subsequent four annual reports.
Georgia Power started as #3 in our first report, and has retained the #4 slot ever since, even as their W/C ratio has more than doubled over that timeframe (to 824 W/C). So their relative position on this leaderboard has more to do with others leapfrogging them rather than any backsliding themselves. Dominion (DESC, formerly SCE&G) is one of those examples.
Another example would be Tampa Electric (TECO), a much smaller utility (less than 1/3 the size of Georgia Power). With over 800 MW of solar in 2021 and 1,090 W/C, TECO has earned the #3 slot for the last two years.
A Blast from the Past
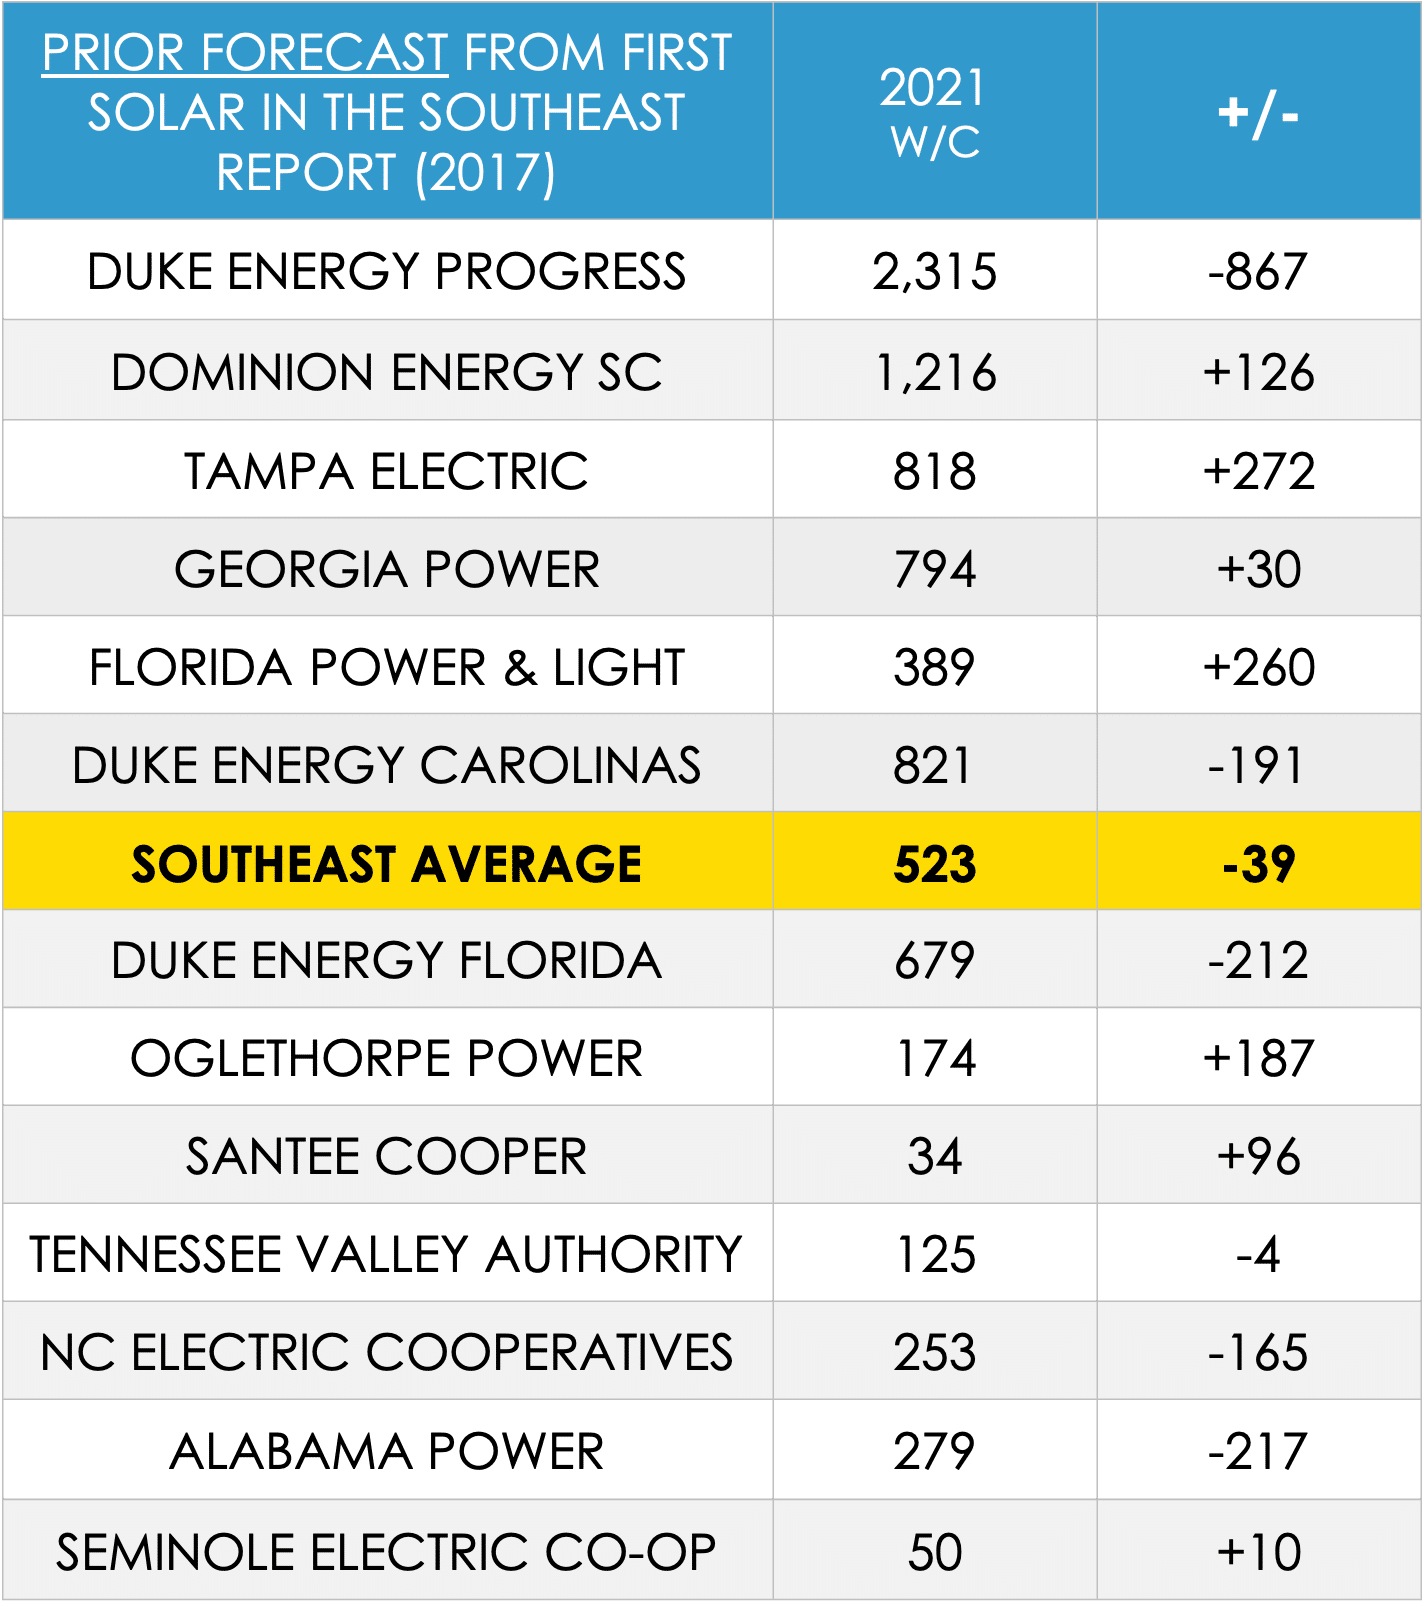
In our webinar corresponding to the fifth annual report’s release, I reflected back on the first annual report and compared the current results with what we had forecast for 2021 back then.

I described it as a bit of a “mixed bag.” Some utilities really overdelivered – and others underdelivered – relative to our forecast. TECO and FPL really exceeded expectations. So did Oglethorpe, because, in that first year, we couldn’t anticipate how much solar Facebook would commission through Walton EMC. The Duke utilities (all three of them) had high forecasts early on and have been consistently dialing those back (at least short-term). We even had a much higher forecast for Alabama Power five years ago. The Alabama Public Service Commission (PSC) had approved 500 MW of solar back in 2015 so we expected that to be done by now (and that would have yielded a solar ratio of 279 W/C). Unfortunately, Alabama Power had only fulfilled about 1/5 of that by 2021; merely 62 W/C.
Looking at the region as a whole, our original forecast from five years ago was for 523 W/C for 2021. In our current, fifth annual “Solar in the Southeast” report, the Southeast Average reflects 484 W/C. While that is 39 W/C (7.5%) lower than we had anticipated, much of that can be attributed to the pandemic.
Our new forecast for 2025 factors in the present supply chain disruption along with the resiliency the sector has exhibited through multiple challenges. No doubt the next four years will be a mixed bag, as well – with some utilities underdelivering and others overdelivering. But if the region average achieves the 982 W/C solar ratio forecast in our current report, that will represent a more than doubling of solar in the southeast to over 30 gigawatts (GW) by 2025.
#SSR2022


