 This blog was written by Steve Clemmer, Director of Energy Research, Clean Energy at the Union of Concerned Scientists and originally appeared on UCS’ blog “The Equation.” The original post can be found here.
UCS released a new analysis [Tuesday] showing that strengthening the contribution from renewable energy can significantly increase the emissions reductions from the EPA’s 2014 Clean Power Plan. We found that increasing non-hydro renewable energy sources from about 6 percent of U.S. electricity sales today to 23 percent by 2030—or nearly twice as much renewable energy as the EPA proposed—could raise the reductions in U.S. power plant carbon emissions from the EPA’s estimated 30 percent below 2005 levels by 2030 to 40 percent. We also found that increasing renewables to these levels is affordable, resulting in little impact on electricity prices and lowering natural gas prices for both utilities and consumers.
The EPA’s renewable energy targets are modest
To establish emission rate reduction targets for each state, the EPA proposed four “building blocks” to identify cost-effective ways to reduce emissions from existing power plants. In addition to increasing renewable energy, these building blocks included improving efficiency at existing coal plants, fuel switching from coal to natural gas, increasing energy efficiency in homes and business, and including the generation from new and “at-risk” nuclear power plants. Importantly, the EPA gives the states flexibility in deciding how much of each building block to include, with some limitations.
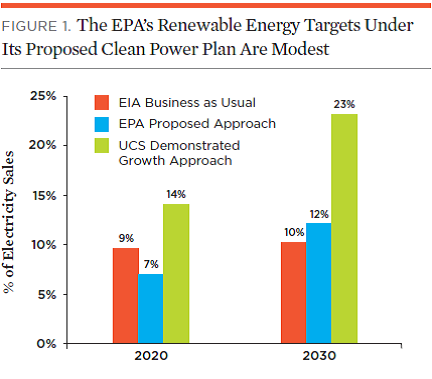
Unfortunately, the EPA’s proposed approach for renewables — based on averaging the 2020 targets of existing state renewable electricity standards (RES) within each of six regions nationwide — resulted in very modest targets.
Our analysis shows that the EPA’s targets include less renewable energy than what the Energy Information Administration (EIA) projects will occur by 2020 under a business as usual scenario (i.e. without the carbon rule), and only slightly more by 2030 (Figure 1).
 This post is part of a series on the EPA Clean Power Plan.
The EPA’s proposed approach also produced several counter-intuitive results at the state level. For example, seven states had less renewable generation in 2030 under EPA’s targets than they have today. And 17 of the 29 states with RESs have lower targets under the EPA’s approach than what is required to meet their existing laws. The EPA’s approach also does not capture any of the recent or projected growth in renewables between 2012 and 2017.
Proposing a stronger role for renewable energy
UCS’s modified approach for setting state renewable energy targets — which we’re calling the “Demonstrated Growth Approach” — improves on the EPA’s approach in several ways. To determine each state’s 2017 baseline generation levels, we use EIA renewable generation data from 2013 and add projected generation from wind and utility-scale solar projects known to be under construction through 2016. To calculate state targets through 2030, we use the four following steps:
- We calculate a national average renewable energy benchmark growth rate of 1 percent of annual electricity sales based on actual state data from 2009 to 2013 from EIA. This period captures most of the recent growth in wind and solar due primarily to state and federal policies and recent cost reductions.
- For states below the benchmark, we assume that they gradually ramp-up to 1 percent per year by 2020, and continue at that level through 2030. This is similar to the approach the EPA uses for the energy efficiency building block.
- For the 15 leading states at or above the benchmark, we assume they continue growth at their 5-year average rate up to a maximum of 1.5 percent per year—a rate that’s consistent with targets set by the leading RES states.
- Finally, we assume that, for states with an RES, they would achieve the greater of our growth rate approach or the level needed to comply with their existing state RES requirements, as projected by Lawrence Berkeley National Lab. In this way, a state’s RES policy serves as its floor that the EPA rule can build on, not a ceiling. We also cap the total share of renewable generation for any state at 40 percent of total sales, a level that several studies by grid operators, utilities, and government agencies have shown can be achieved at the state and regional level in this time frame while maintaining reliability.
More renewables in every region of the country
Our approach results in more renewables in every region of the country and nearly every state than the EPA’s approach (Figure 2). The largest increases occur in the Upper Midwest and West – in states where renewables have already experienced rapid growth and in states that have made strong commitments to deploy more renewables in the future. Our assumption that states fully comply with the existing RESs has the greatest impact on the Northeast and Mid-Atlantic states. While the Southeast has the lowest overall target of 14 percent by 2030, they would experience a similar percentage increase in renewables over current levels compared to other regions.

Higher renewable energy targets are affordable
Using the National Renewable Energy Laboratory’s Regional Energy Deployment System (ReEDS) model, we analyzed the impacts on electricity and natural gas prices of achieving the state renewable energy targets under the UCS approach compared with business as usual (BAU).
Our analysis included updated technology cost and performance assumptions that are consistent with what we used in our May 2014 Game Changer analysis of a more ambitious set of climate and clean energy policies, which found that the U.S. could reduce power plant carbon emissions 60 percent below 2005 levels by 2030 (about twice the levels included in the EPA’s proposal) at a net savings (see more details here).
We found that diversifying the electricity mix with renewables would have minimal impacts on electricity prices and help restrain the growth in natural gas prices. Under the UCS approach, national average consumer electricity prices were a maximum of 0.3 percent higher per year than BAU through 2030. As a result, a typical household (using 600 kWh per month) would see an increase of no more than 18 cents on their monthly electricity bill. Under the UCS approach, the national average price of natural gas in the electricity sector would be 9 percent lower than BAU by 2030 (see figure).

Previous studies by UCS, EIA, and LBNL have shown that reducing natural gas in the electricity sector can also help reduce consumer natural gas prices for heating and manufacturing. These benefits are not captured in our analysis, which uses an economic model that focuses only on the power sector.
Our findings are also consistent with a recent NREL and LBNL study that found that between 2010 and 2012 the actual cost of complying with RESs in 25 states ranged from a net savings of 0.2 percent of retail rates to a net cost of 3.8 percent, with a weighted average cost of 0.9 percent.
Our analysis is a reasonable approximation of the incremental cost impacts of increasing renewables under the Clean Power Plan. We did not analyze the full impacts of implementing the entire draft rule, but focused exclusively on the renewable energy building block. In addition, these results assume national trading of renewable energy credits (RECs). If there are any restrictions on trading, experience shows that REC prices would likely be higher in some regions and lower in others.
More renewables deliver greater CO2 reductions
The modeling also showed that our proposed approach would reduce power sector CO2emissions by an additional 10 percent by 2030 at the national level, with renewables displacing mostly natural gas. Therefore, using our approach in setting state emission reductions targets could increase the total CO2reductions achieved by the Clean Power Plan from the EPA’s estimated 30 percent below 2005 levels by 2030 to nearly 40 percent. If more coal were displaced, total emissions reductions could increase above these levels. Improvements in energy efficiency and other building blocks could further increase the total level of emissions reductions.
Expanding the role of renewables
To fully harness the power of renewable energy to affordably reduce carbon emissions, the EPA should revise its renewable energy building block methodology and adopt stronger targets that better reflect growth rates already being achieved by leading states. The EPA should also better reflect the recent and projected near-term growth in renewable energy and incorporate full compliance with existing state RES laws.
The UCS proposal provides a powerful framework for expanding the use of renewable energy and putting us on a path toward a clean, affordable, and low-carbon electricity system.